TIME SERIES
Layered area and line chart
Compare data sets with layered lines, area fills, and data points.
 EN
ENDATA VISUALIZATION
Copy & paste your Vega-Lite content directly into a Markdown code block and Notes Plus renders the result right instantly. Build charts with your data, keep the source readable, and refine everything in the same note. All data is just a simple code block in a local Markdown file.
TIME SERIES
Compare data sets with layered lines, area fills, and data points.
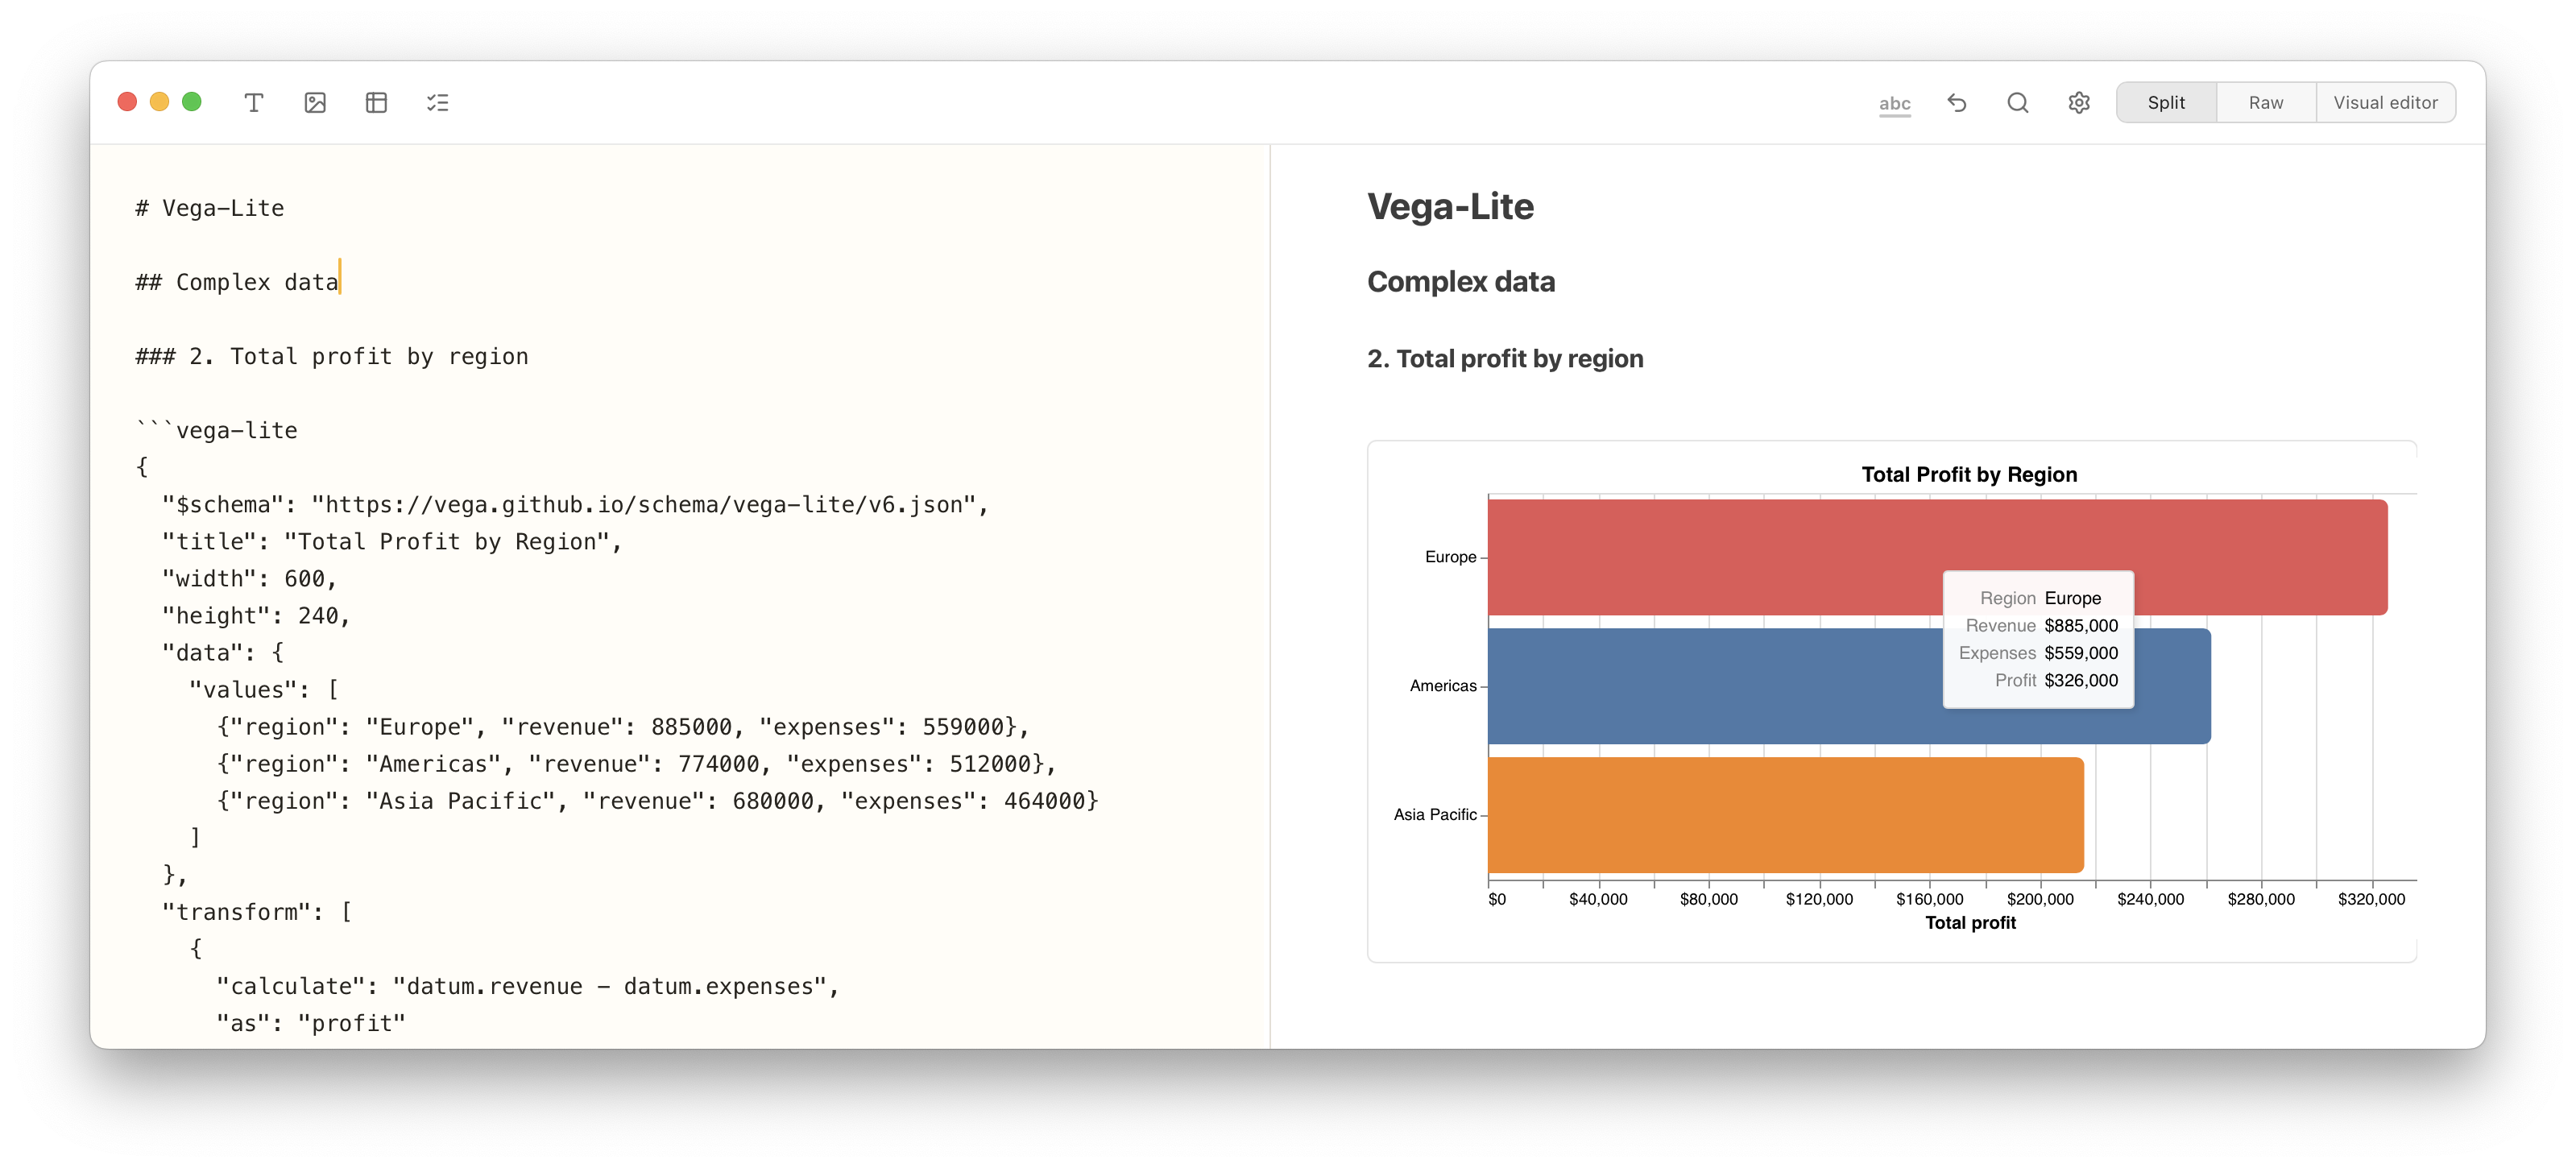
AGGREGATION
Summarize a dataset with concise, easy-to-read bar charts.
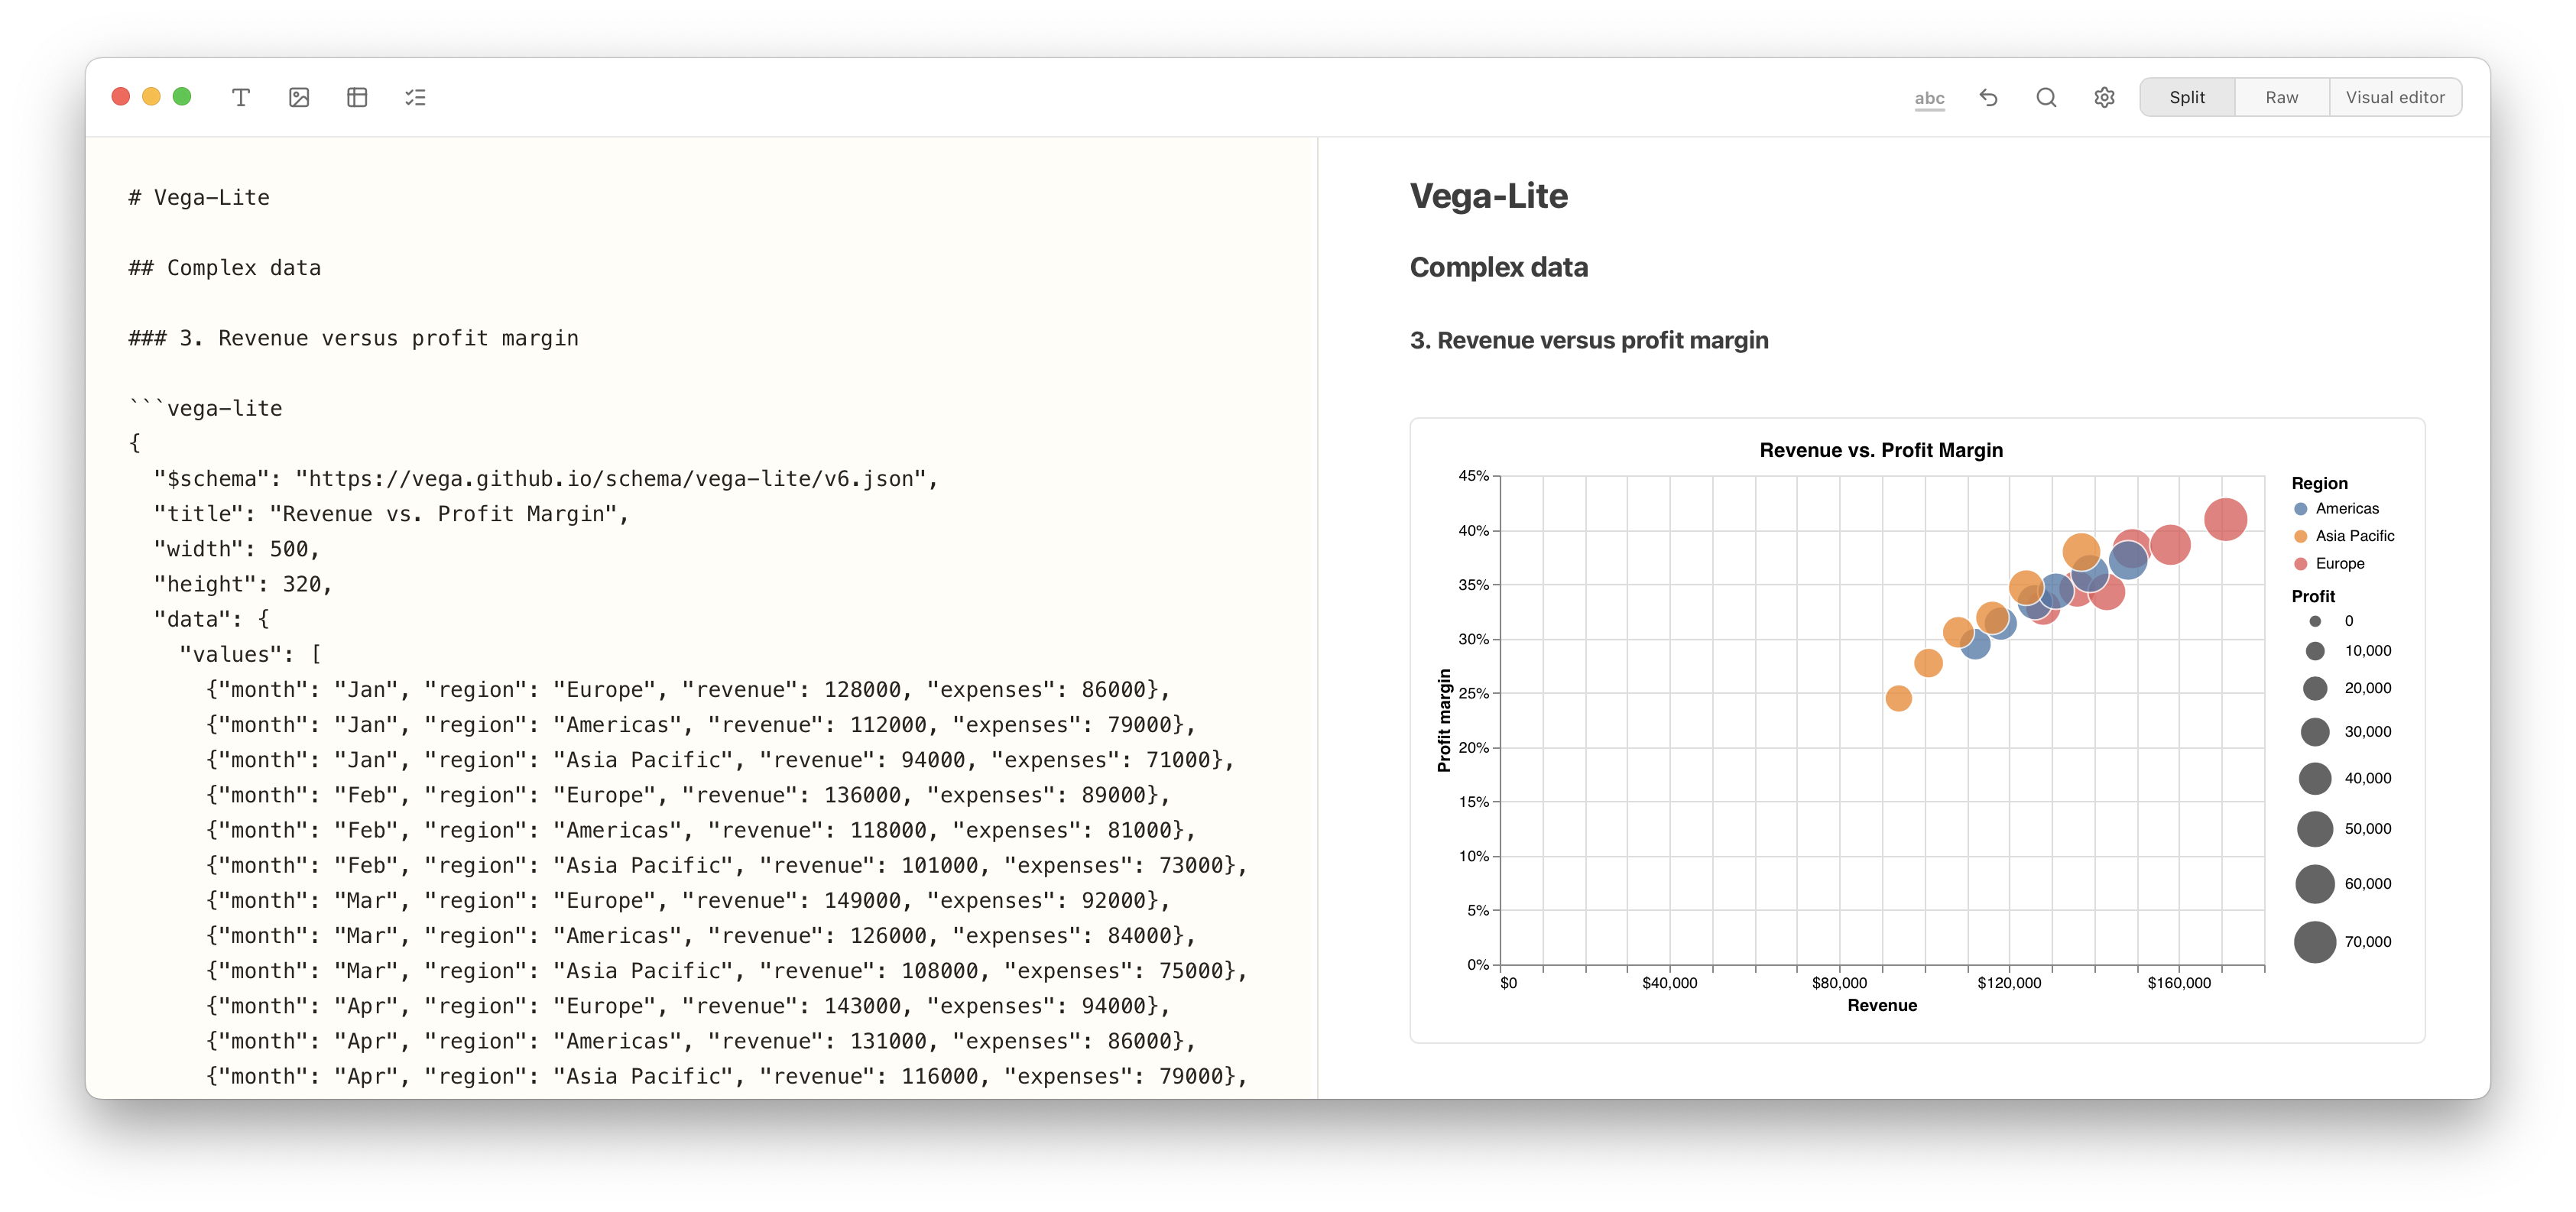
MULTIVARIATE DATA
Explore several dimensions at once using position, colour, and size.